
 Gordon Stokes
Transport
How much traffic would be generated by a new development?
Last updated - March 2015
Pages in this series
1 - Transport Assessment Introduction
2 - Trip generation
3 - Routes taken by traffic
4 - Pass by, diverted and other trips
5 - Other aspects
6 - Transport in Environmental Statements

Trip Generation - Summary
Trip Generation in Transport Assessments refers to the amount of travel a development is expected to produce. In most cases, before a development is built it's not easy to be certain how many people will use it as employees or customers, or how many deliveries will be made. So various standard techniques are used, but they can be used in different ways.
The "Trics" database
For the UK and Ireland there is a database known as "Trics" which contains data from surveys made of existing developments, which show in a standard format, for each hour of the day, how many people were recorded arriving and leaving on foot, by bike, and the number of vehicles. In some cases public transport users are recorded, and goods vehicles are usually available separately from cars. (It should be noted that if an existing site is simply being expanded it's more usual to conduct a small survey and scale up what exists.)
Trics is the industry standard way of assessing how much traffic will be associated with a site,
and is widely accepted as the most trusted way of doing so in the UK.
The database is valuable to consultants writing TAs, and is only available by buying a licence,
or by buying particular 'runs' from the "Trics Consortium" who own and run it - a group of
Local Authorities.
Link to Trics Website in new window - www.trics.org
Trics has enabled a degree of agreement between developers and Local Authorities about how much traffic may be expected. But it does have drawbacks, which are worth noting:
- Although there's a lot of developments in the database, there are some land uses for which there are very few records, such as libraries. If a run only includes under about 5 sites it may be saying more about the detail of one or two 'odd' ones than about libraries in general. And of course a proposed library might not be a typical one in terms of traffic.
- Even for more common developments (such as housing or supermarkets) once characteristics such as location and numbers of people living within certain distances have been used to filter out dissimilar sites, the numbers can become very low. In order to get a reasonable number of cases it may be necessary to include examples that are not like the one in question.
- It generally only includes developments for which counting people and vehicles in and out is straightforward. Nearly all are freestanding developments with their own car park, and where someone has a reason to do such a survey (which explains why, for example, there aren't many libraries or churches).
Assessing "Trics" outputs
So while the database gives an air of authority (and is indeed generally the most authorititive source of information) readers of a TA should check:
- That there is full information about the run of the model that produced the results. These usually show two or three pages detailing the cases used, the days of the week for each one, the size of development, where the development was located in relation to town centre etc., the type of area it's in (suburban, or industrial), and populations within certain distances. It may also record whether supermarkets have petrol stations, and whether the development has a travel plan.
- If that information is not available then the Trics guide to good conduct has not been followed.
- That the 'comparators' accord roughly with the proposed development. They will never all fit the bill exactly, but if the ones listed are in town centres and the development is in a suburban centre then traffic is likely to be underestimated.
- That the days of the week accord with what the developer says they are measuring. Most TAs for retail developments are done for a Friday and Saturday because these are the busiest days of the week for shopping. Some runs for 'weekday' can include much quieter days earlier in the week (which is ok for most land uses other than shopping). Some TAs do not include a different run for Saturdays.
- That trips in and out are shown for most hours of the day (usually 7am to 7pm or longer). Some TAs will only show 'peak hour' traffic (usually 8-9 and 17-18 on Fridays and 12-1, 1-2 or 2-3 on Saturdays), but all recorded hours should be shown. These will have been made available by the Trics Consortium and should be shown along with the information about the run.
If the full information is not shown then readers should be very doubtful that the data shown is correct for the proposed development. It is likely that they have simply looked at somebody else's outputs and picked what suits them - this is very common for smallish housing developments, but can be the case for others too.
If the 'parameters' are shown, then some lee-way should be allowed for a run that contains some cases that don't seem to fit what is proposed, but they should be checked, and queried if it seems like cases may have been chosen that don't fit. Runs are done by selecting parameters, and using the average of all that fit, but individual cases can be taken out (for ethical or unethical reasons).
Most large consultancies have their own copy of the database, which gives them the scope to tweak the results more finely. For the above reasons this can be a good or bad thing in terms of accurately predicting traffic. It's often worth trawling the web for other TAs to check whether a similar development has come up with similar trip generation rates. In many cases a run that says it has been done by the Trics Consortium, rather than the consultant, may be taken as being more 'honest' because they are less likely to take out 'inconvenient' cases to get the desired result.
Reality checking
Trics outputs usually show numbers of expected trips per 100m2 'gross' floorspace. For some land uses, outputs may be per seat (for restaurants, cinemas etc), per room (for hotels, care homes etc), or per dwelling for housing. These are then scaled up to the size of the proposed development. It's worth reality checking this against other knowledge (though it should be pointed out that while many of us would imagine most houses might produce 2 vehicles leaving in the morning rush hour, this isn't true of the average even in leafy suburbia).
- But I've seen some TAs where existing detached houses are expected to produce 7.5 vehicle trips per day (when most runs show a maximum of about 5.5), while replacement flats are expected to produce about 1.5 per day compared with more typical results of about 3.3. (These cases did not show the parameters used to reach those results).
- I've also seen a TA where a cinema was proposed with a large floor area but a number of seats that was far smaller than similar sized cinemas would have. Using 'traffic per seat' gave a much lower generation than 'traffic per 100m2" would have given.
You can find out more about the various sites used in the Trics runs at
Link to Trics Website in new window - www.trics.org/land_use_search.aspx
To find a site, check the Trics output in the TA and find the serial such as "OX-04-C-01", then
click "Go" by the relevant land use type, select a sub group from the drop down list, and then you
can click "Select" for the right one - Sounds easy but you have to know which sub land uses are
found where!
What is realistic for different developments?
As said above, detached houses may expect to generate around 5 to 5.5 vehicle trips per day, depending upon location etc. These, like for other landuses, include all vehicles coming and going - not just residents, but friends visiting, post vans, couriers, double glazing salesmen etc etc. Similarly those to a supermarket will include the people who work there, deliveries etc.
The graphs below will show typical use profiles for different development types. They are loosely
based on published TAs for a variety of developments. The first below shows retail uses for a weekday.
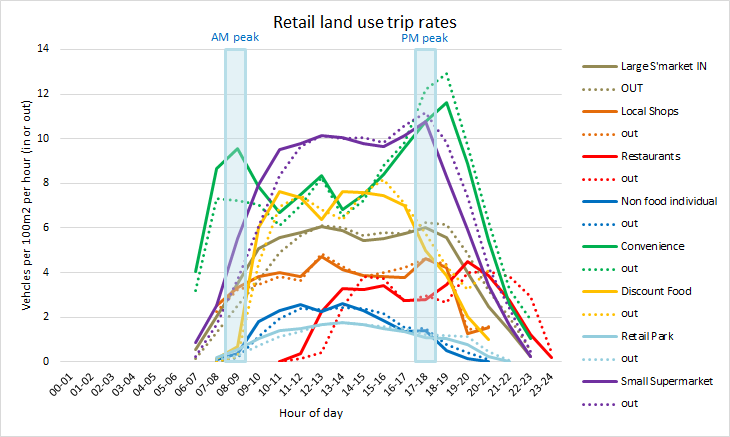
What's apparent is just how much different retail types vary in terms of;
Generally, non food shopping has much lower rates per square metre than food shopping, and, in
general the smaller to store, the higher rates per m2. Convenience stores have very high peak
levels of traffic and much less during the interpeak daytime.
What one describes a land use as can have very different implications for the level of trip
generation forecast. A developer is unlikely to want to describe what they are building as a
convenience store, but they may like to suggest that what is being taken away is one.
Many applications for supermarkets use large ones (over 5000m2) even when the store is very
much smaller. It's actually quite difficult to find applications with Trics data in for
smaller supermarkets.
The next page is concerned with how trips are estimated to be
distributed in the local transport network
Back to Transport Index
Gordon Stokes, 2015