
 Gordon Stokes
Transport
Analysis relating to peak car
Last updated - Jan 2013
Pages in this series
1 - The idea of Peak Car
2 - Graphic analyses of trends
3 - More analyses of changes
4 - Attempt to forecast future car use

I wrote this material on peak car in 2012-13. Although the data is somewhat out of date now, I think the basic principles still apply.
Graphic representations of access to cars over time
This page shows a series of dynamic graphics that show how key aspects of car use have changed over the years. They all make use of National Travel Survey data (see foot of page for further information).
The graphs were made using 'dynamic gif' files. I'm still developing these, and each has a different degree of accuracy in labelling as to what they actually are. For some reason they run slower on an i-pad - not sure why.
To begin with some may look pretty brash - it's best not to have two different ones on the screen at the same time! But once your eyes get accustomed to them you can actually make out quite complex patterns of change. In most of them the general pattern is graphic enough to show how the situation has developed. If you gaze at different parts of a graph, or concentrate on one of the lines you can hopefully get to see more complex stories - holding the cursor in a particular place will help.
Each one follows something through time, with a longer gap when it reaches the most up to date data.
The graphs basically show:
- The percentages of people with access to a car
- The distance driven per year, for people with differing levels of access to a car
- The total distance driven in a year by people of different ages
How access to a car has changed over time
The National Travel Survey classifies the person who says that they drive a particular car the furthest of anyone in the household as the 'main driver'. In the graphs below the percentage who are a main driver, then those who are also drivers are shown. There's four of these below - two for males and two for females. The first of each keeps age 'constant' along the horizontal axis, people who are, say, 40, in one year are compared with people who are forty in the next period. The second, for each gender, keeps year of birth constant, so that people born in 1950 are compared with the same 'cohort' of people next time.
Figure 1 - Access to a car (1985/6 to 2008-10) for males, by age
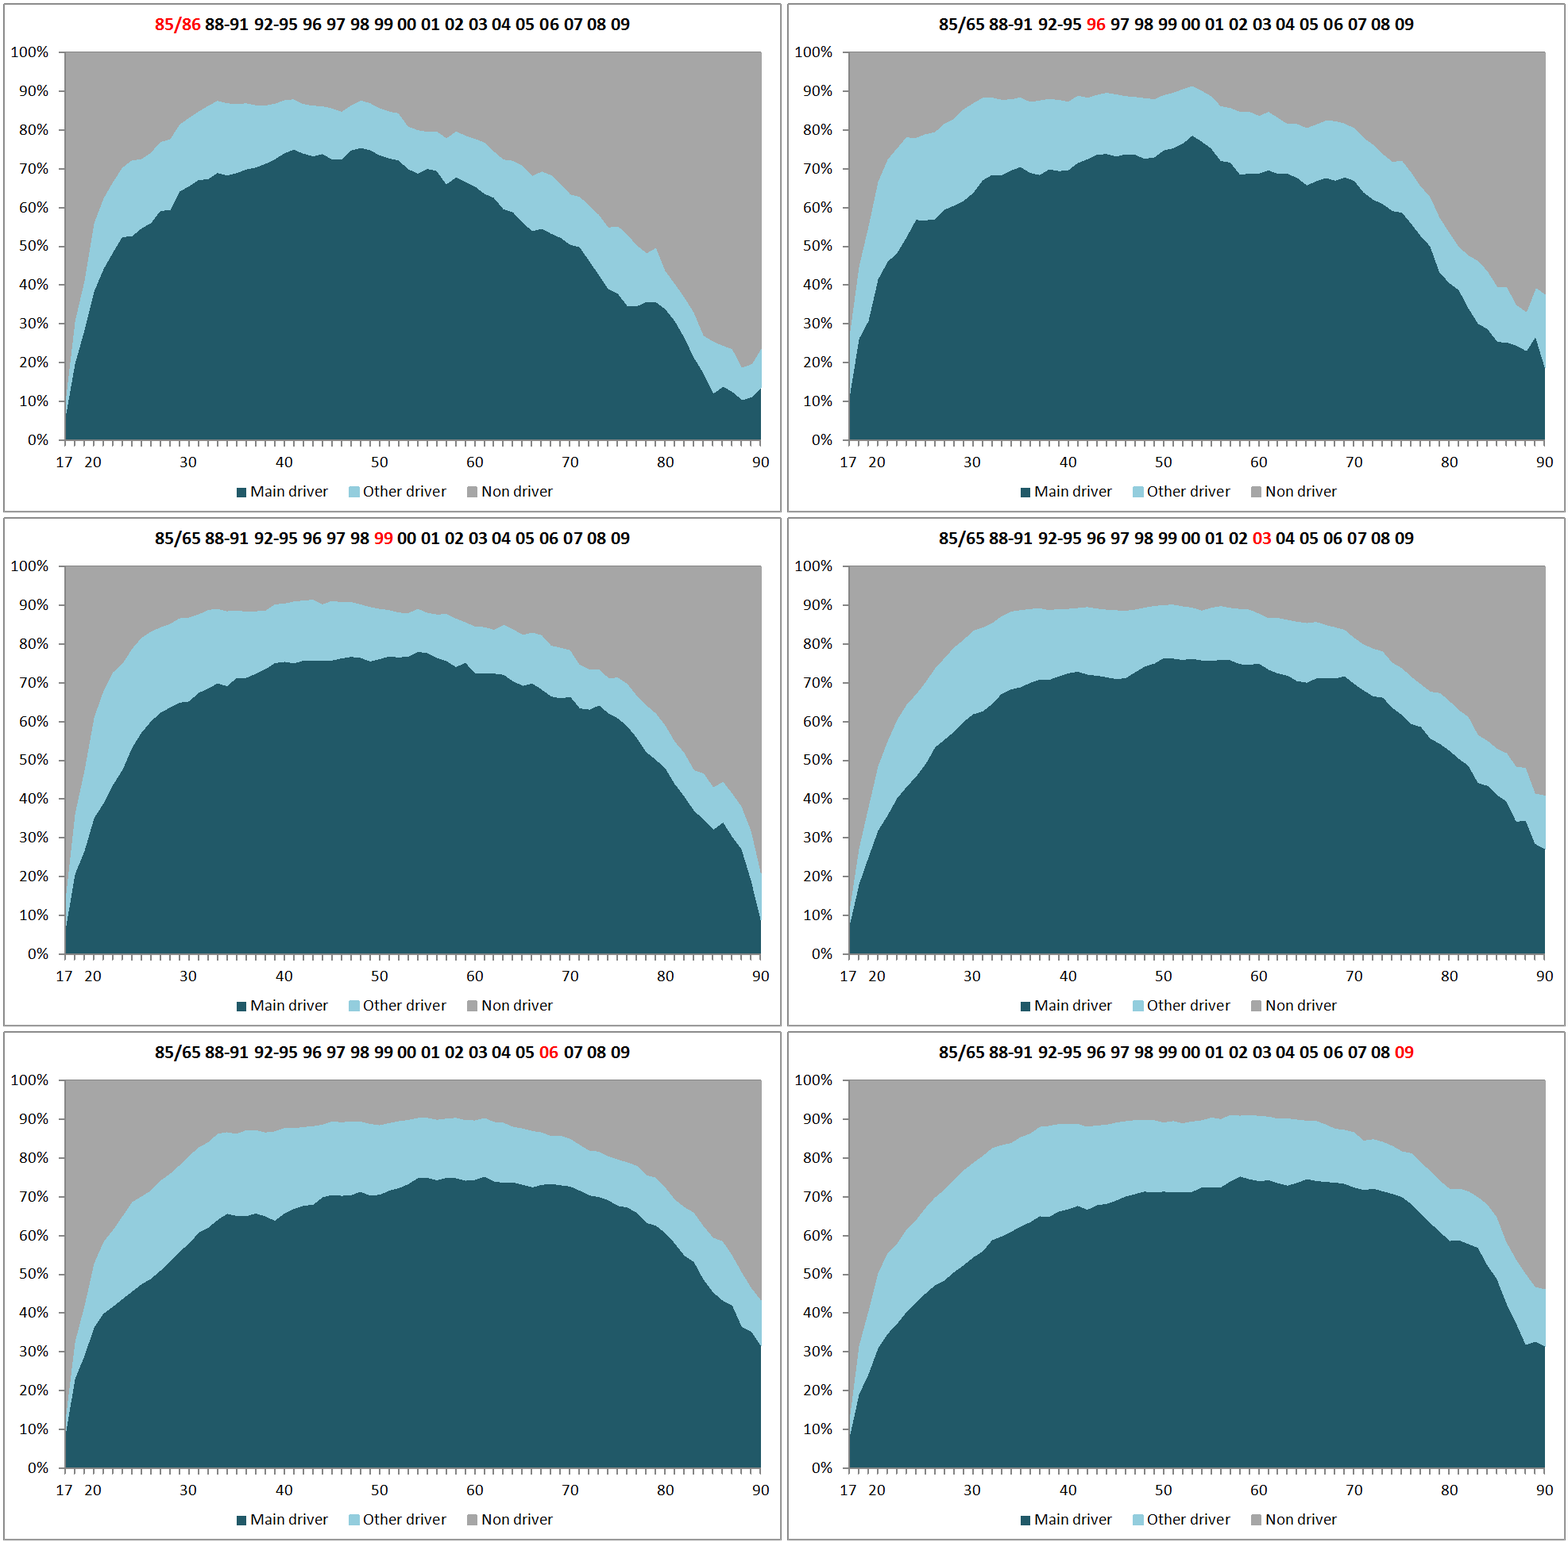
If you relax your eyes you can see a sort of 'wave' of car access moving along as the years go by. You can also see that after about 1992-95 the rate at which men gained car access slowed - the steepness of the climb to the highest rate of car access becomes less steep. At the same time a large 'body' of car access moves along through the years into older age.
The reason for this is that once people gain car access, it seems they are loath to forego it as they get older. So by 2008-10 it's clear that people in their 50s and 60s have higher rates of car access than those in their thirties and forties. Figure 2 shows this in a different way.
An earlier less detailed version that you can control more can be found
 HERE
Figure 2 - Access to a car (1985/6 to 2008-10) for males, by year of birth
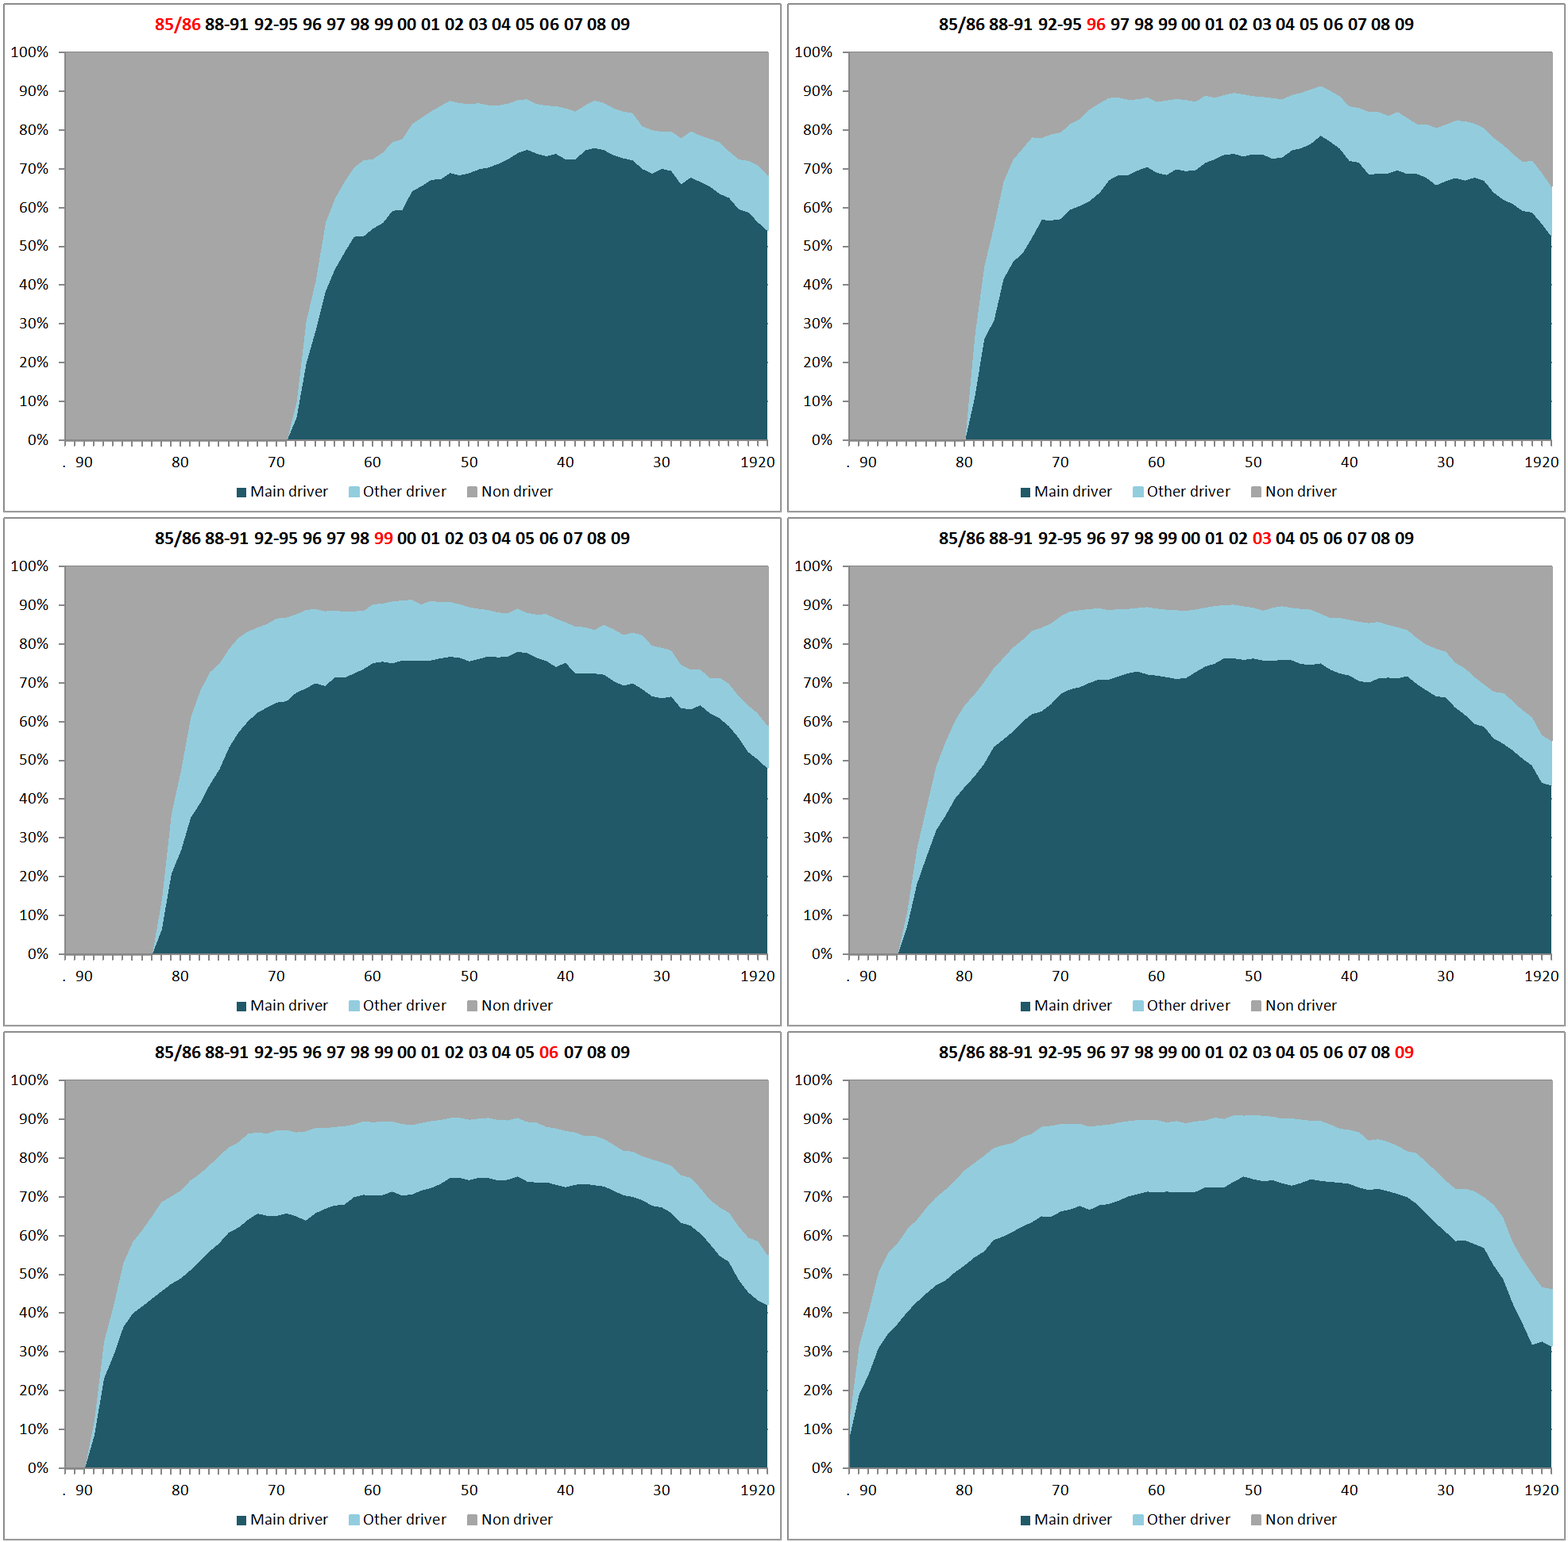
If you look at a particular part of Figure 2 you can see how access to a car has changed over time for people born in one year. For people born between 1920 and 1930 it's clear that they have got consistently lower access to a car as they've aged, so that by 2008-10 for these people (who were in their 80s) about 25% had access to a car as a main driver, while about 60% had in 1985/6 (when they were in their 50s and 60s.
But men born in 1960 - In 1985/6 (at the age of 25) around 55% had full car access, but by about 1990 this had risen to about 70%, and has stayed at about that level ever since. For people born in the 1940s there has been very little change over the 25 year period - most who were going to drive had started doing so, and very few have given it up.
Figure 3 - Access to a car (1985/6 to 2008-10) for females, by age
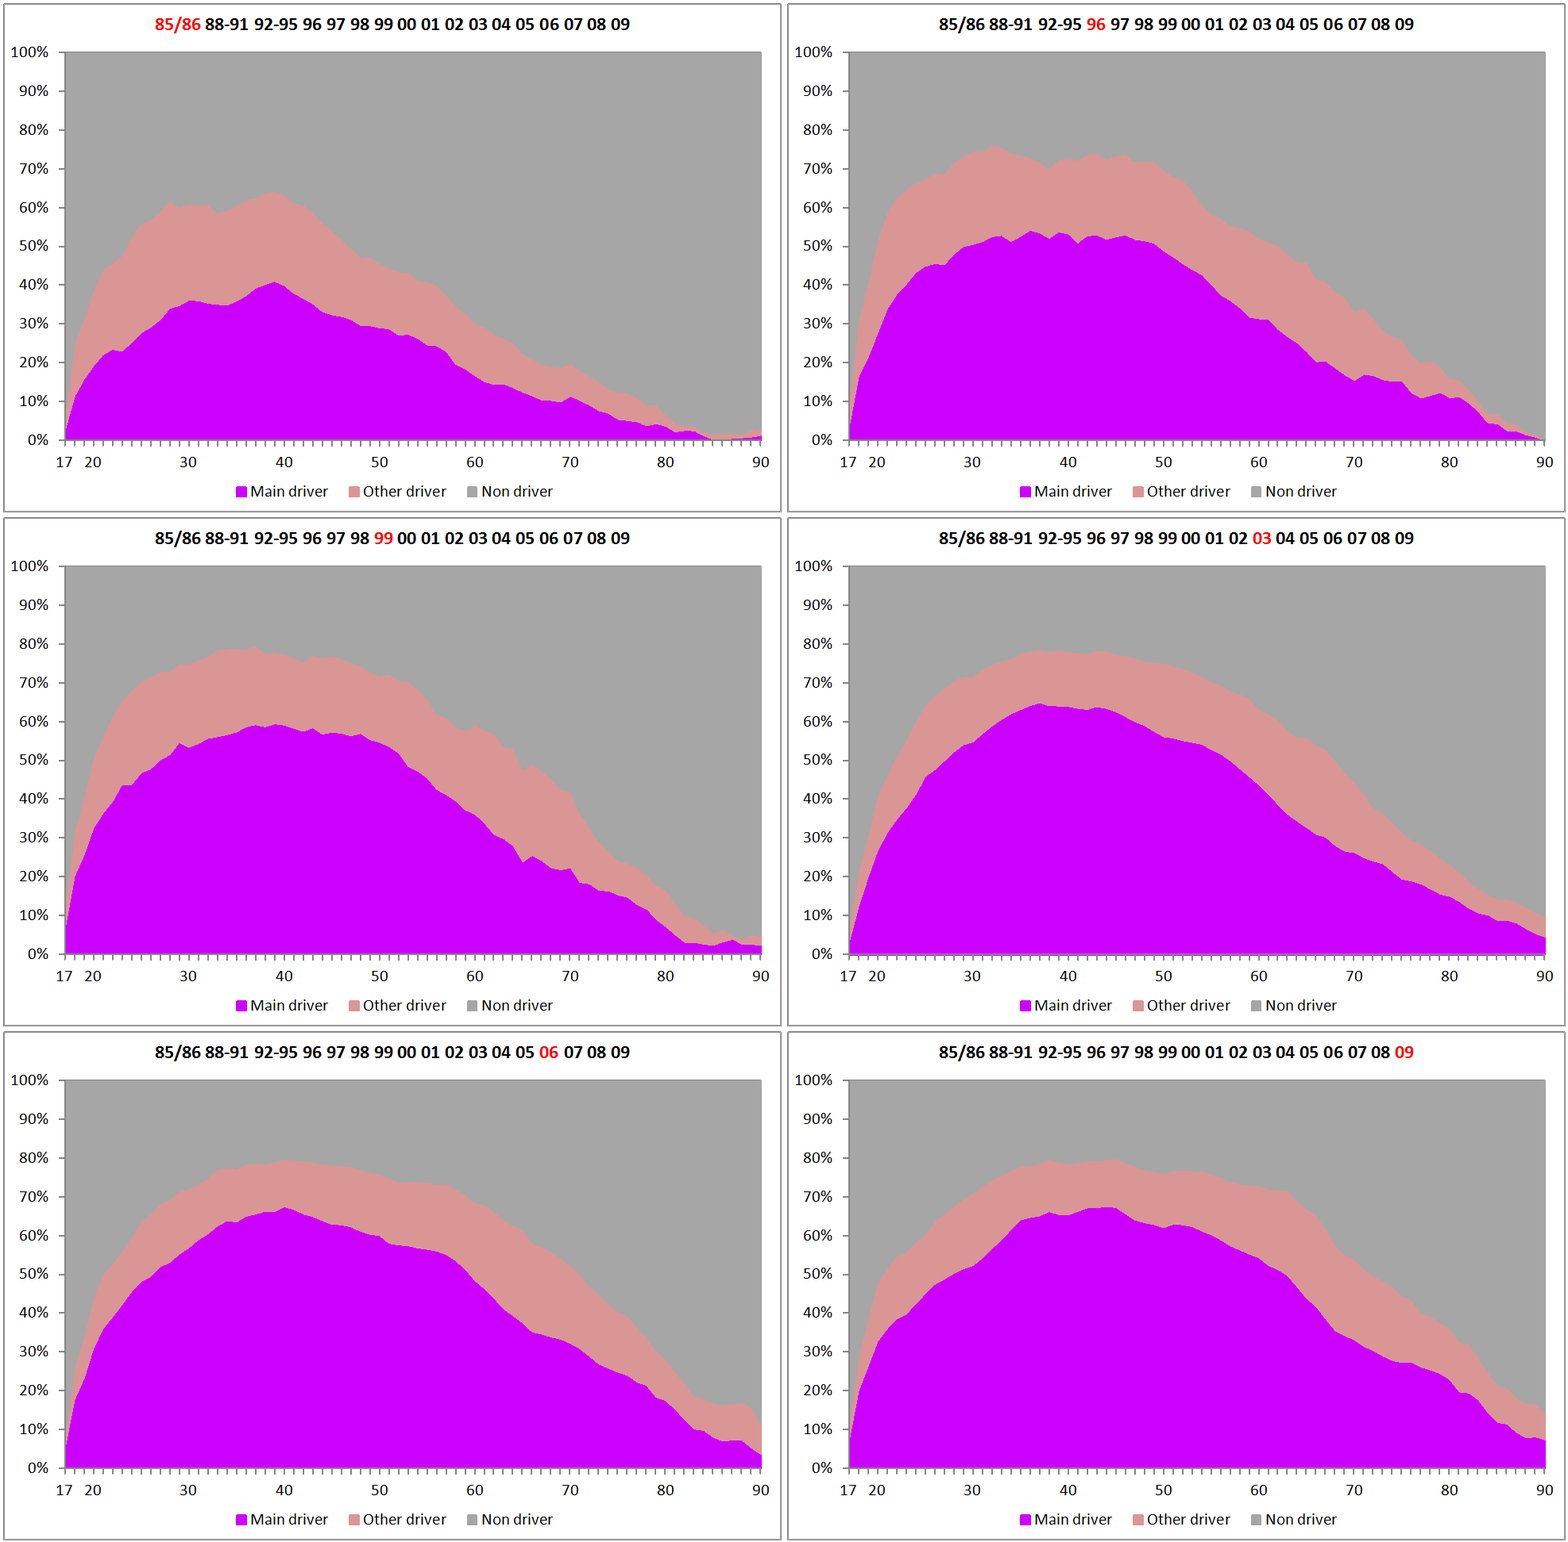
The graph for women is very different to that for men, and the way it has developed since the mid 1980s also very different. While men showed growth in access to a car up the early 1990s, followed by a lowering af access especially amongst younger men, the graph foe women shows a large amount of increase through most of the period up to the mid 2000 to 2010 decade. Since then growth has slowed down, and maybe stopped.
Figure 4 - Access to a car (1985/6 to 2008-10) for females, by year of birth
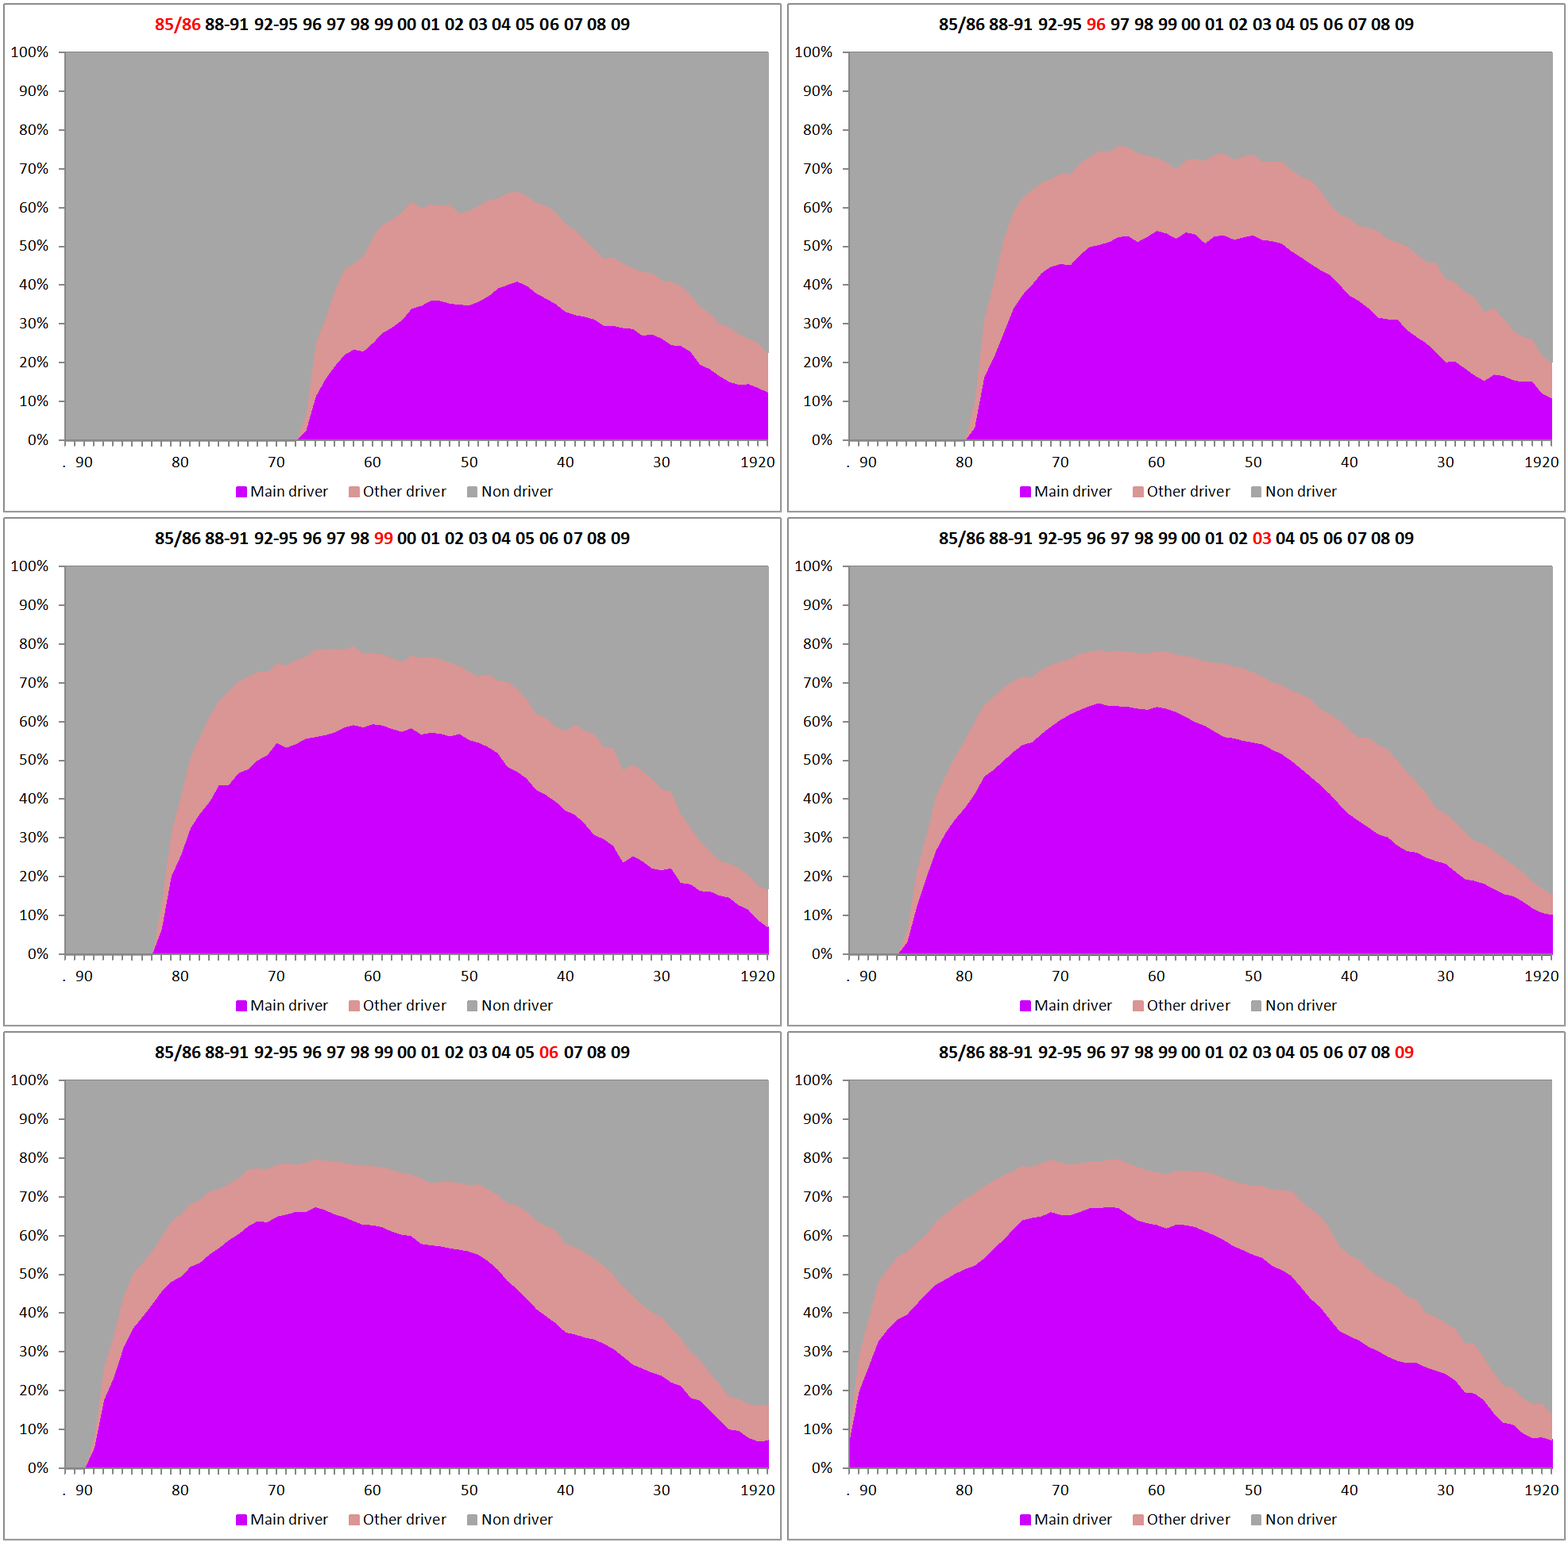
By year of birth, car access for women has tended to increase to a much greater extent than for men. But for women born before about 1960 it has stayed relatively stable since the early 1990s.
Distance driven per driver
Main drivers of cars tend to drive very much further than 'other drivers' - not surprising in many ways because a main driver is defined as the person who drivers furthest in a household car. As people get older they tend to drive less, with retirement taking away the commute journey as probably the main factor.
Figure 5 - Miles driven per year by male drivers 1996-2009
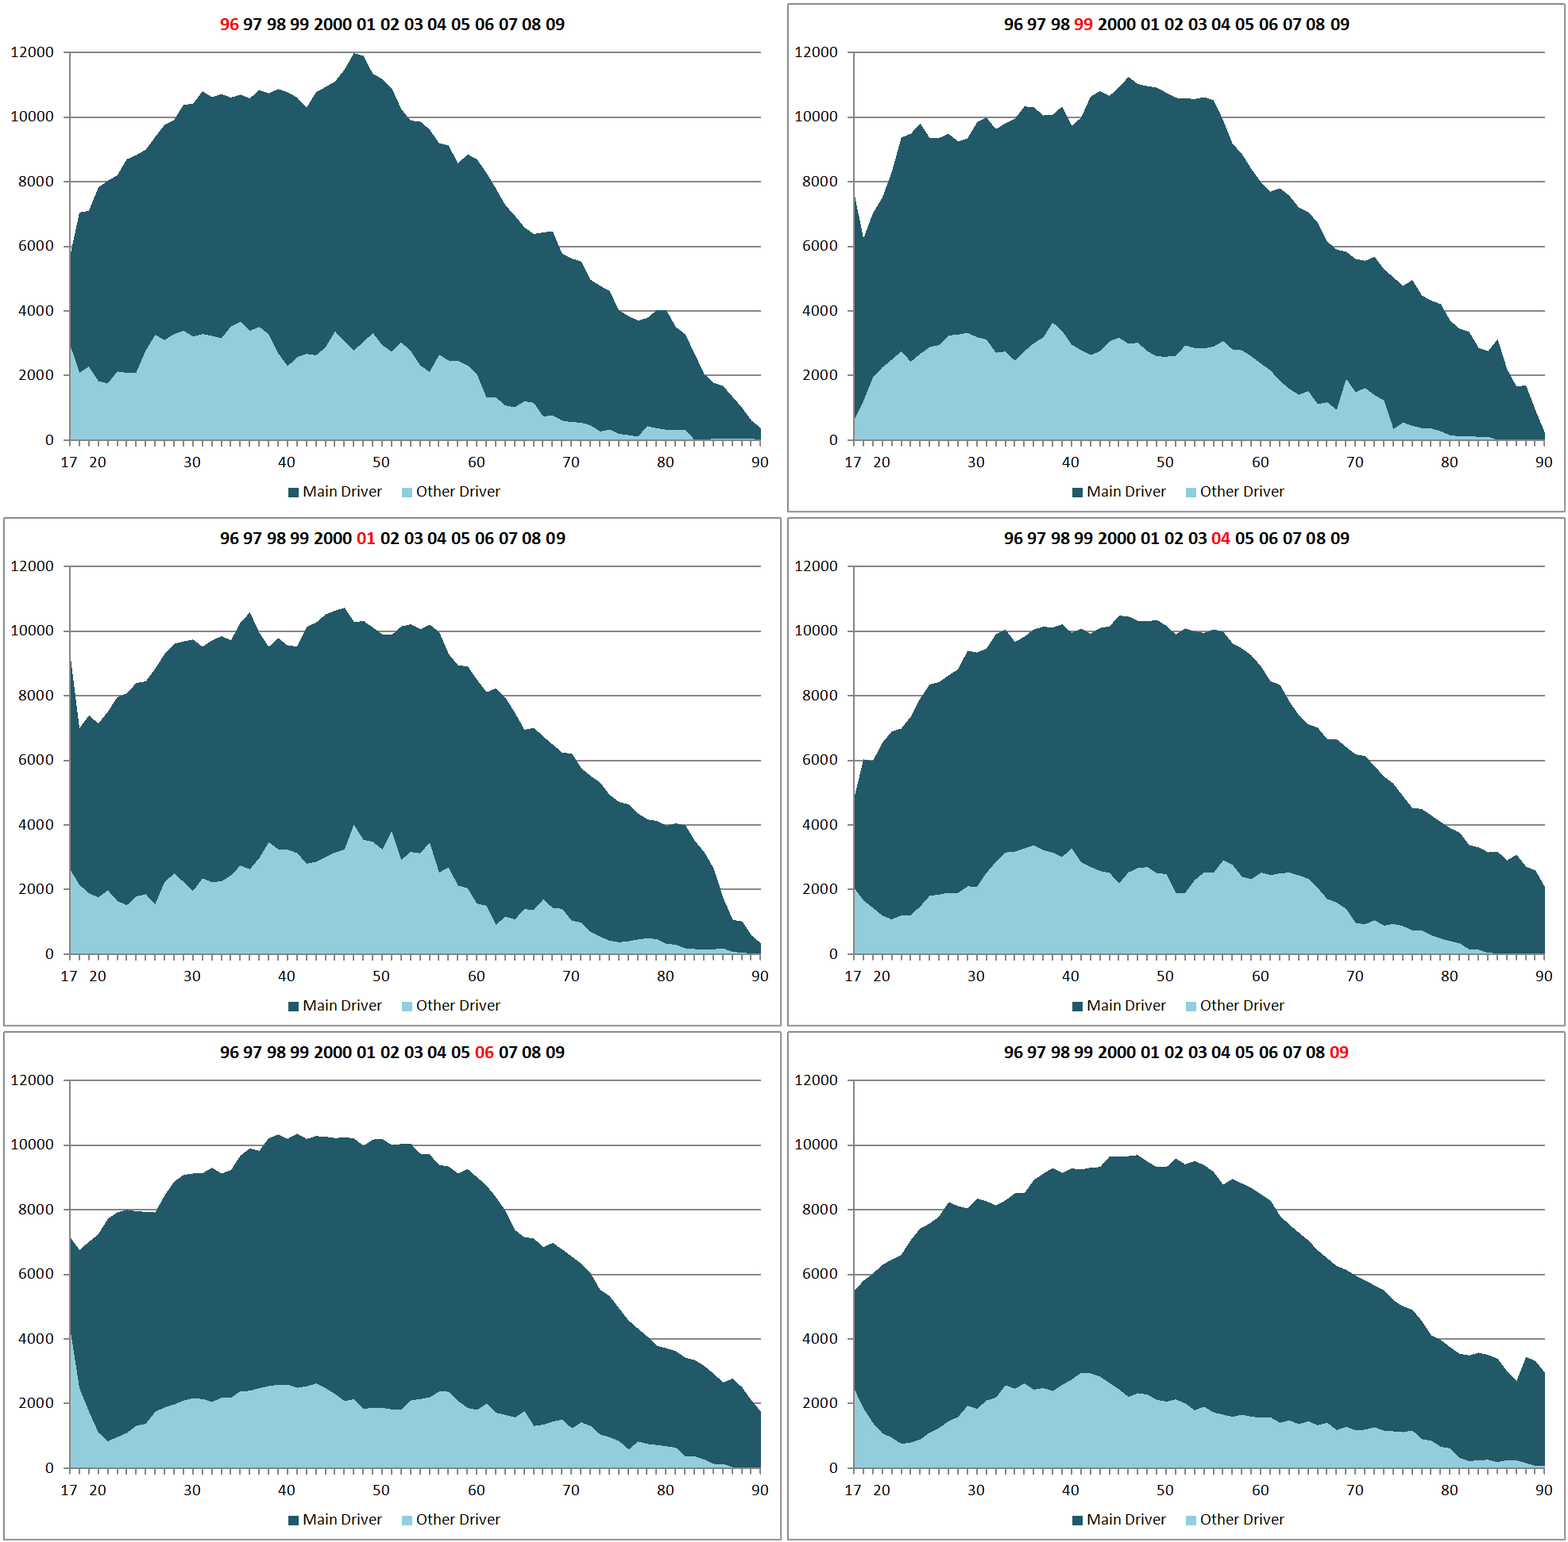
For men (Figure 5, above) the distance driven by those under about 65 has fallen quite markedly over the whole period, while for those aged over about 65 it has stayed fairly stable. In the early years of the graphs there is a distinct peak for men aged about 50 which diminishes over time. This may be related to the larger number of company cars that were in use then.
Figure 6 - Miles driven per year by female drivers 1996-2009
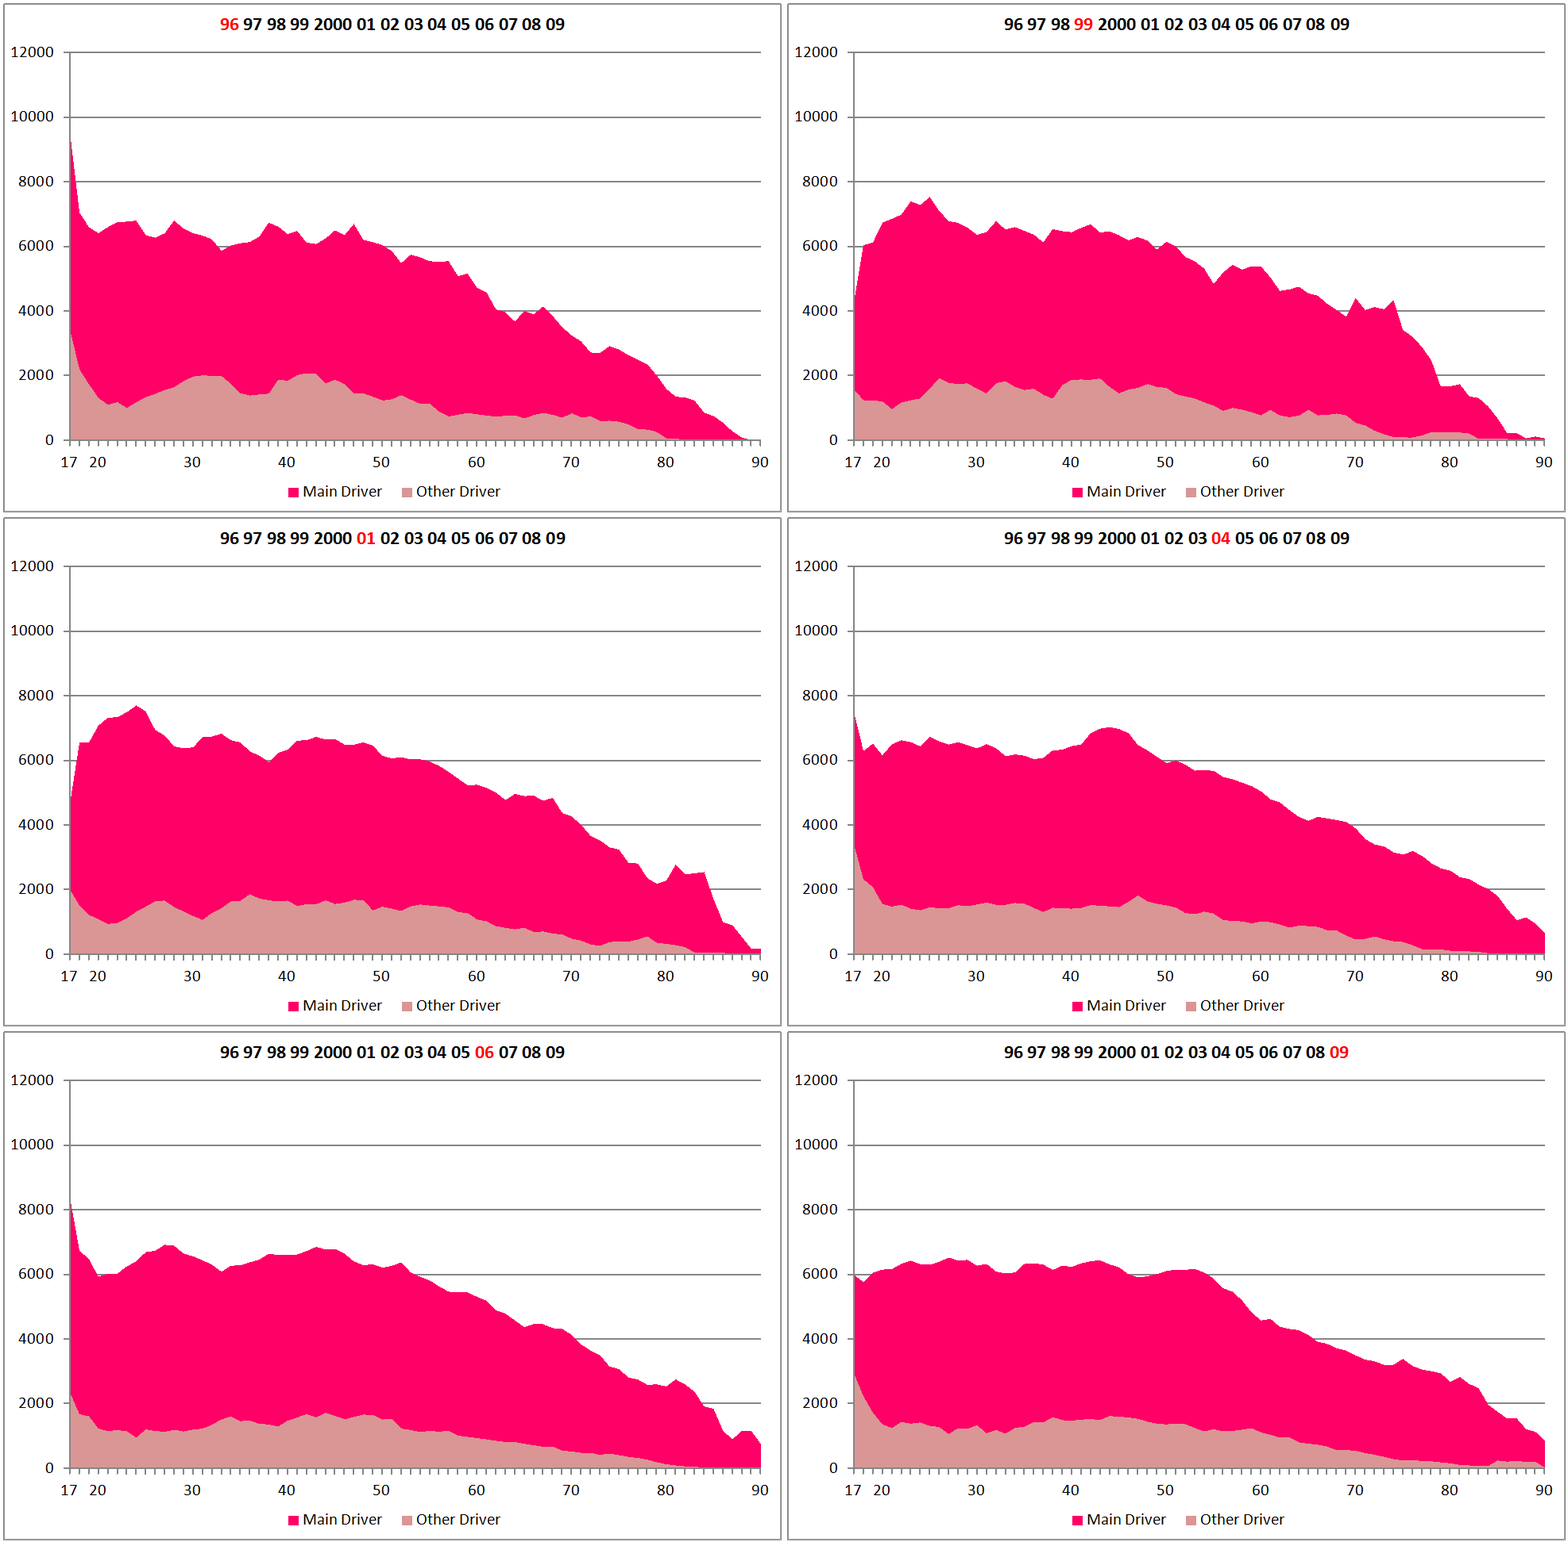
For women (Figure 6) the main image is one of little change over time. Like men, women tend to drive less as they age, but their mileage when of working age tends to be very much lower than for men, and has not increased during the period while female employment has been growing. The evidence tends to suggest that women still tend not to travel so far to work as many men do, and a larger proportion of women will be engaged in looking after children which is generally associated with a large number of short trips for which a car is often deemed essential.
The total distance driven per year
By summing the distance driven by the entire sample and weighting it according to the number of people in the survey we can see how the total distance travelled has changed over time for people of different ages. This isn't quite the same as multiplying the average level of car access by distances driven by those drivers, because the age profile is not 'steady'. The post war baby boom and a smaller boom in the 1960s mean that there are more people, so the mileage is higher than it would be otherwise.
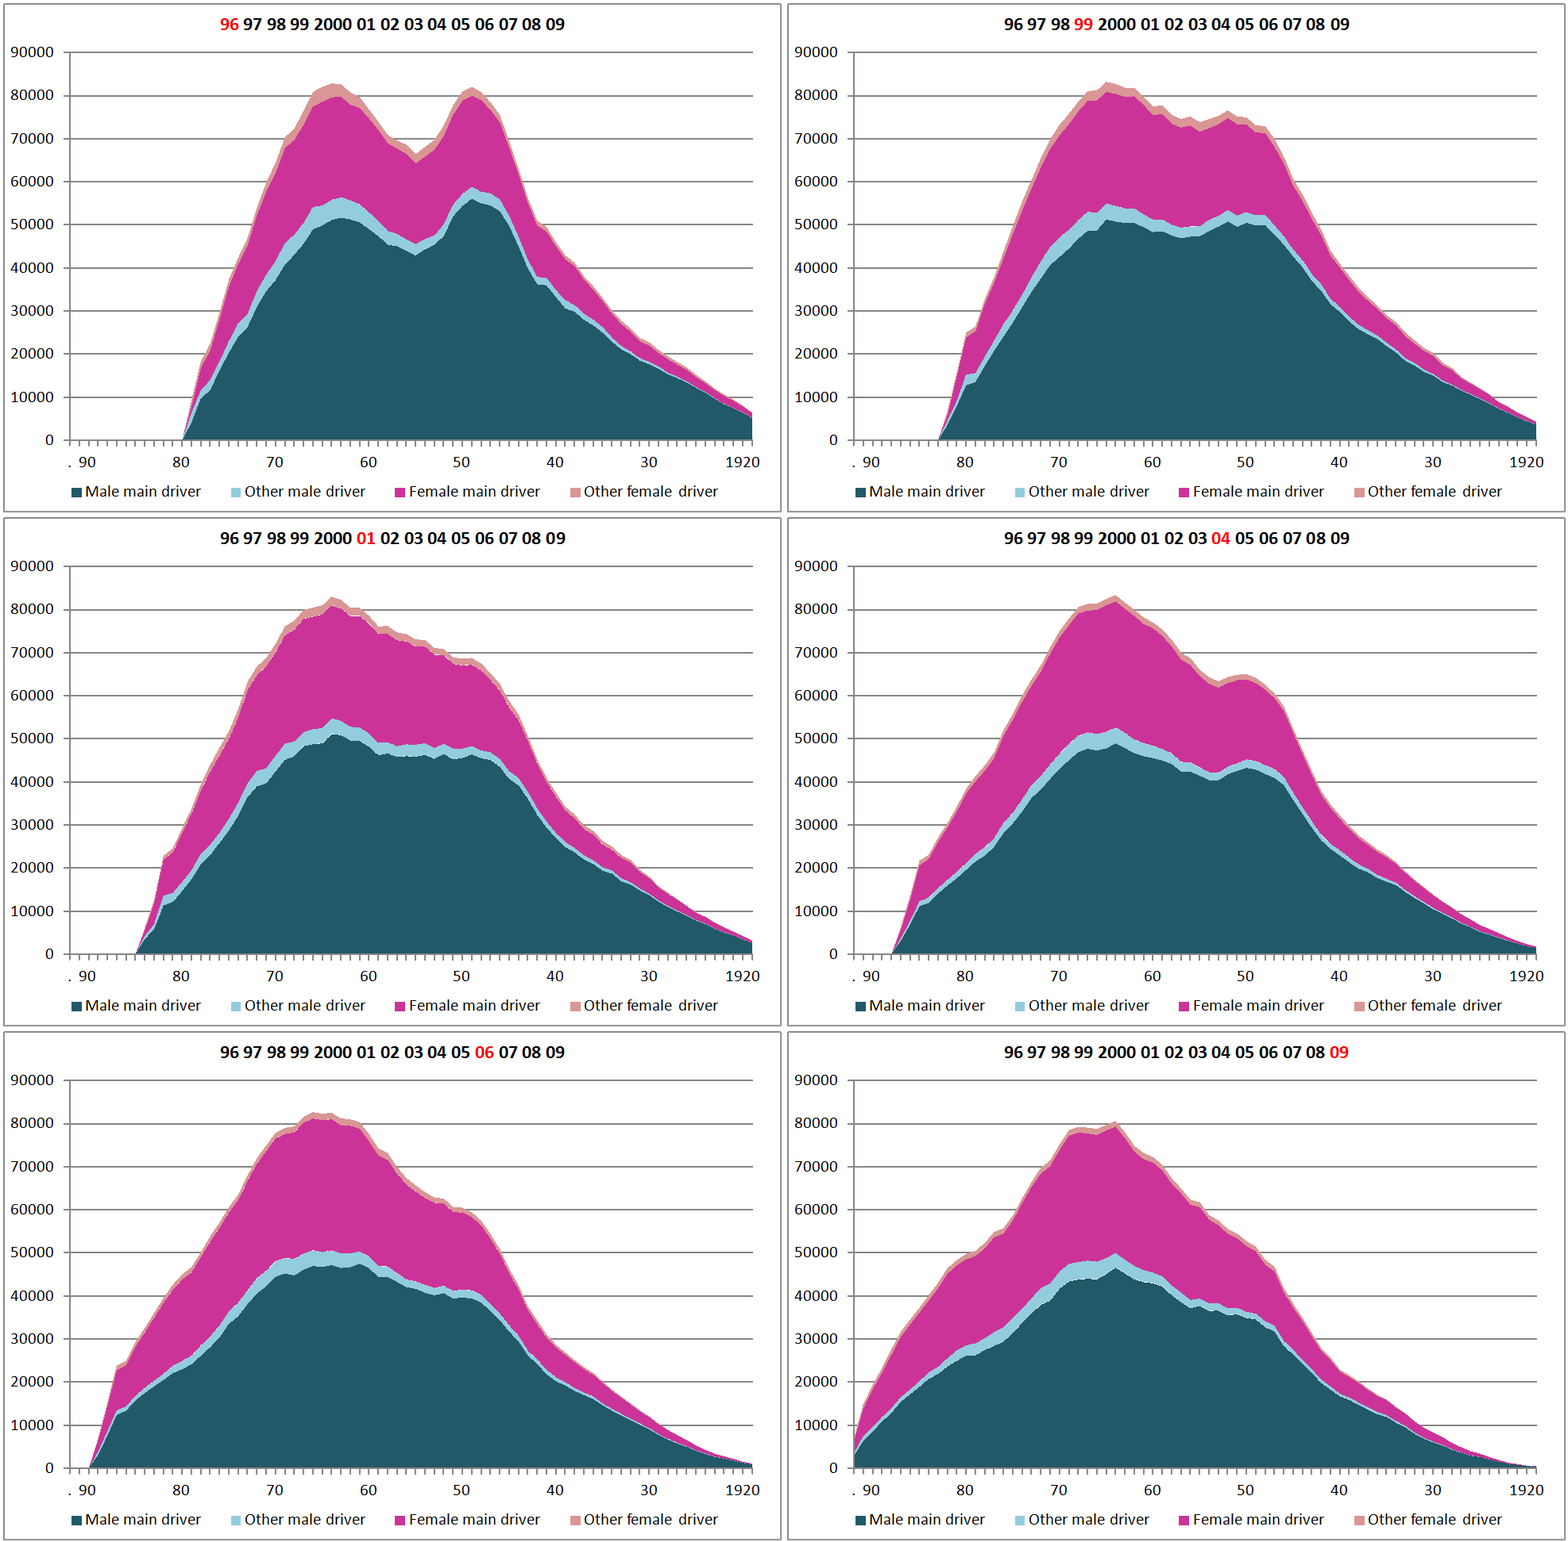
These too birth 'booms' are very visible in the early stages of the graphs in Figure 7 (though it was noted in Figure 5 that those from the first baby boom had higher average car mileage in the mid 1990s, probably due to high levels of company car access). Over time the post war boom disappears, but we are left with a distinct peak of car use for people born in the mid 1960s. It's also fairly clear that the distance driven has been falling for men, while rising for women.
The slowing of the rate at which car use 'grows' by age is also apparent, as is the maintaining of the slow fall off in older age.
Figure 7 - Total distance travelled each year by age
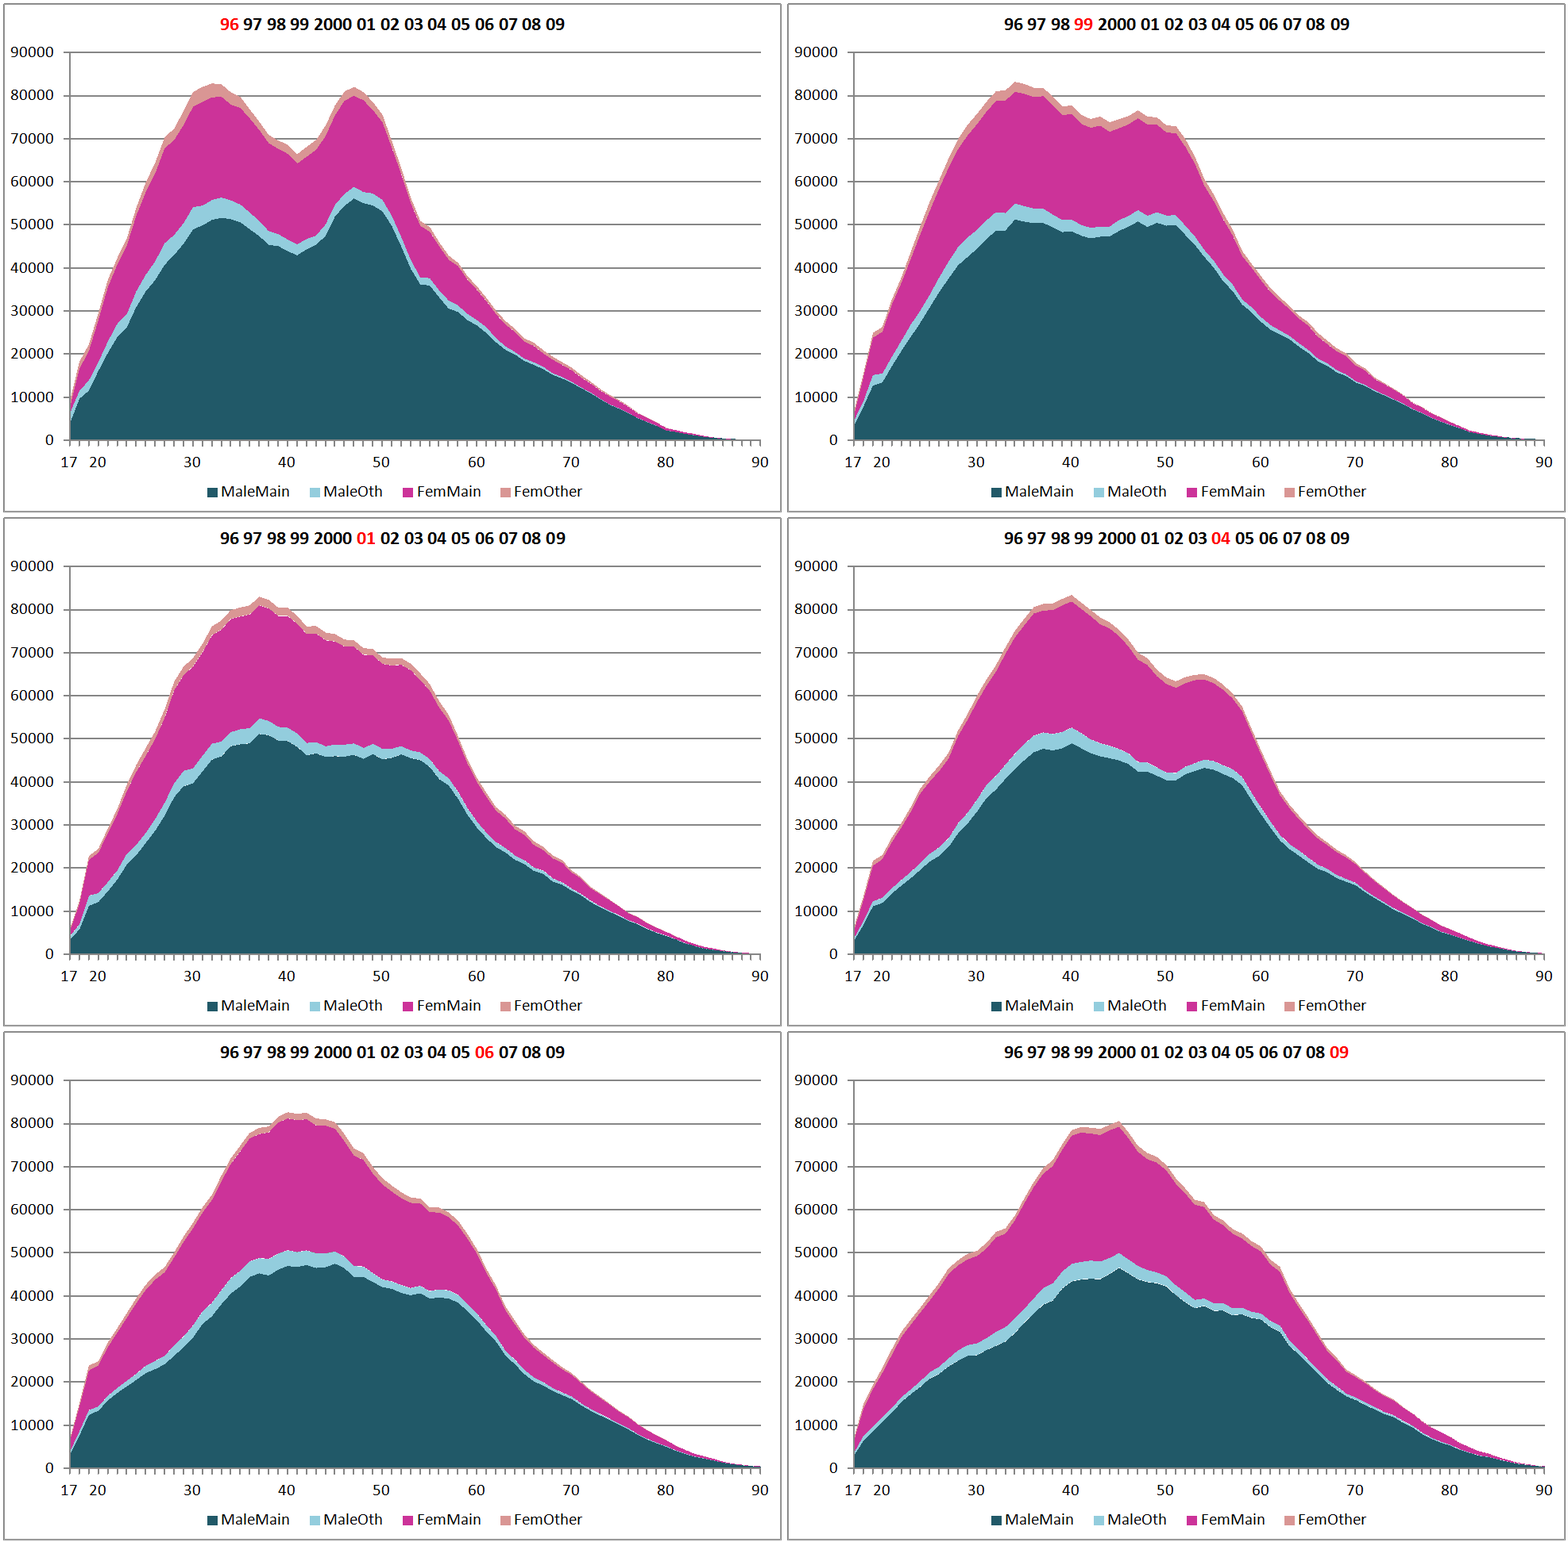
Some of the changes are easier to see in Figure 8 which holds birth year constant. In this figure the 1960s peak is seen to overide all else, being the highest peak of driving, and remarkably constant throughout the 15 year period. The post war baby boomers, however, start at a similarly high level, but their car use diminishes over time.
Figure 8 - Total distance travelled each year by year of birth
What to conclude?
There are a number of points which seem to show through these grpahics.
- The rate at which men gain access to cars in their late teens and twenties has slowed quite dramatically
- But in older age people with cars are holding on to them
- For women, there is still some growth in car access for the younger age groups, but is not marked. What is more marked for women is that there is some scope for growth in their amount of car mileage as they keep driving when they get older
- It seems that distance driven by drivers seems to relate to age, and less to a cohort effect
- While people hang on to cars as they age the amount they drive has stayed relatively stable for women of any age with a particular level of access to a car, but has fallen steadily for men
- Up until recently there was growth in mileage for younger women, but this has levelled off
My interpretation is that there was a peak of access to cars for men during the 1990s, and since then a steady fall in car access amongst younger men, accompanied by the increase for older men. The rise for older men is probably 'habit' of not giving up cars, rather than older men gaining cars. For women, the growth during the eighties and nineties is clear, and growth has continued. But there may be a sign in the last slide that younger women are reaching the stage where car access may have reached a peak. It may be due to recession, but it may be more than that.
My overall interpretation? I'm not an economist, but to put it in economic terms, I think that the propensity for men to access cars used to be well above the utility offered by the car up until recently. Over the last fifteen years it as dawned upon many that maybe the car isn't so wonderful as it seemed, and the pattern of access is returning to something more like the utility that it offers. But coupled with this, habit is a strong determinant of behaviour, and so men with cars are not giving them up until they are in their 80s. What the 'true' level of utility is, is difficult to define, and could change as other factors in society change.
For women the situation is different. A mix of less power and income (probably coupled with a bit more sense in many cases) meant that the car never achieved the status it did for men, but there is still, maybe, some potential for growth, but even for women, most of the growth now will be from older women not giving up cars, rather than more younger women acquiring them.
The next page shows further analyses of related issues that help to explain what seems to be happening.
Source - National Travel Survey from the UK Data Archive, with additional variables provided by the DfT National Travel Survey Team. The research for this has been done in relation to my Visiting Research Associateship with Transport Studies Unit in the University of Oxford. I am writing this up as a TSU Working Paper which I hope will be published in the spring of 2013.
Gordon Stokes, 2013