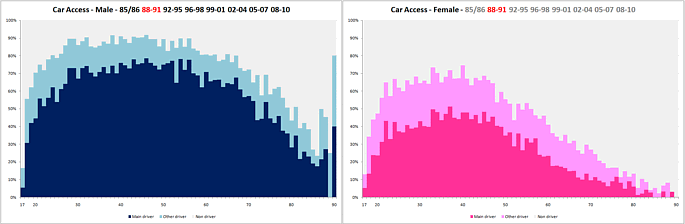
Evolution of car access
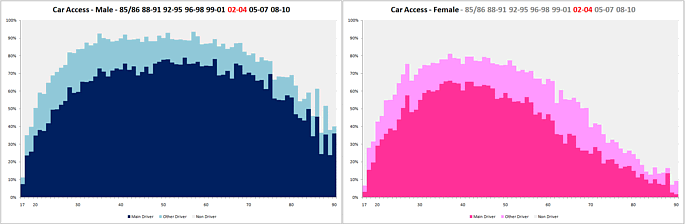
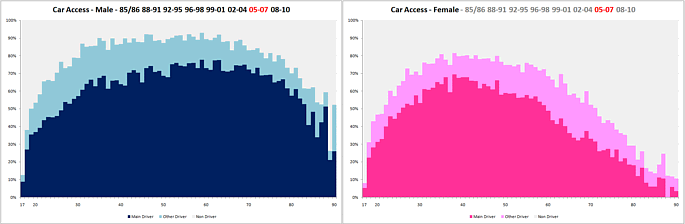
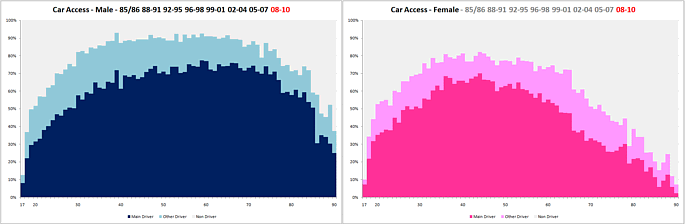


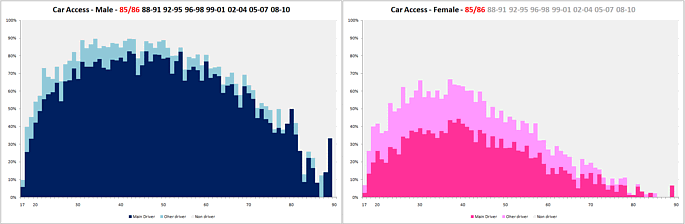
Pass the mouse over the thumbnails above to pick a set of years
or to view as a slide show
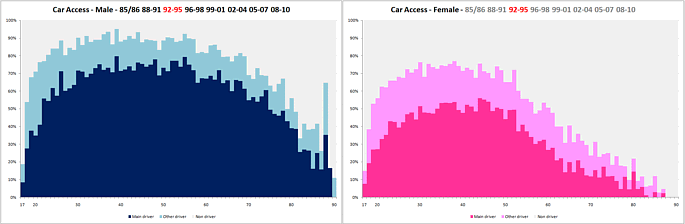
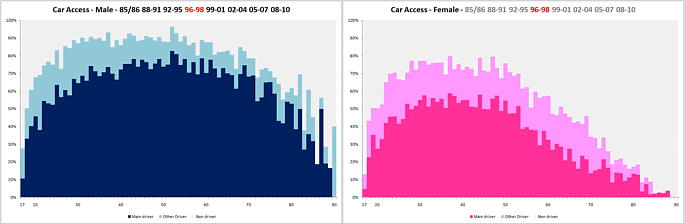
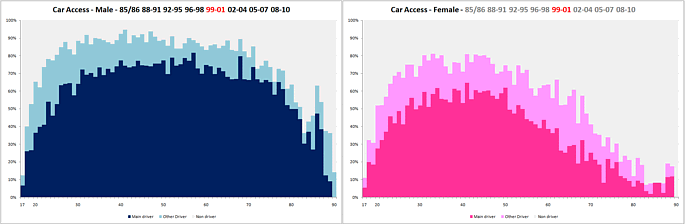
These show car access for people of each year of age from 17 to 90, for men and women, from 1985-6 to 2007-10 for Great Britain. Most of the charts have an average gap of three years between them, but the earlier ones are a bit less frequent. It uses data from the Department for Transport's National Travel Survey, made available by the UK/ ESRC Data Archive to Transport Studies Unit, University of Oxford
Gordon Stokes, 2012